Bullying Statistics
Frequency
- 1 in 3 adolescent students report being bullied in the last 3 months.
- Bullying behaviour peaks for boys in Grade 9 at 37% and in grades 8 and 9 for girls at 28%
- In a 2006 study, 39% of students reported that they bullied, and 20% reported both bullying and being bullied themselves.
Source: Boyce, William F. (2006). “Healthy Settings for Young People in Canada”. Public Health Agency of Canada at 93-94.
Amount of Bullying by Grade Level
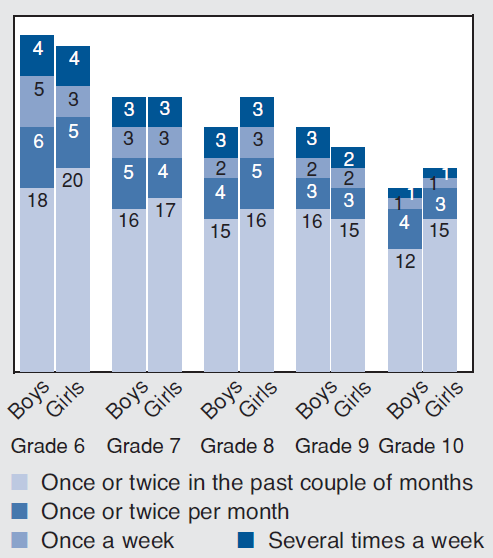
Students who are victimized and do not bully others, by grade, gender, and frequency.

In an analysis of 2002 data, Canada ranked a dismal 26th and 27th out of 35 countries on 13 year-old students’ reports of bullying and victimization, respectively. As the graph above shows, students report a consistent decline in victimization from Grade 6 to 10. Most students were bullied once or twice every few months, with 3% reporting bullying several times a week.
Source: Boyce, William F. (2006). “Healthy Settings for Young People in Canada”. Public Health Agency of Canada at 94.
Likelihood of Bullying behavior
Students who bully others and are not victimized, by grade, age, and frequency (%)

There is a gradual increase in bullying behaviour from grade 7 to 9. Most students who reported victimizing others did so infrequently, with a small minority (5% at most) engaging in regular bullying of other students. Further, a substantial number of students reported being both victims and bullies. 24% of Grade 8 boys and 18% of Grade 8 girls are both bullies and victims.
In a study of students aged 10-17 years old:
- approximately 10% engaged in chronic, high levels of bullying;
- 35% reported a consistent pattern of moderate level bullying; and
- 42% reported that they had never bullied others.
The research found that children who bully others frequently were establishing a way of interacting that could carry on into adulthood. These children used aggression and power to get what they want and to control others. It was more likely that these children: were in conflict with their parents, had peers who bullied, had a higher susceptibility to peer pressure, and lacked remorse for hurting others.
Sources:
Boyce, William F. (2006). “Healthy Settings for Young People in Canada”. Public Health Agency of Canada at 94-95.
D. Pepler et al. “Developmental trajectories of bullying and associated factors” (2008) 79(2)Child Development 325-338.
Sexual Harassment Statistics:
Harassment by Type:
- Making sexual comments, jokes, gestures, or looks (66 %)
- Touching, grabbing, or pinching in a sexual way (49%)
- Intentionally brushing against a person in a sexual way (47%)
- Flashing or “mooning” (43%)
Source: “Hostile Hallways: Bullying, Teasing and Sexual Harassment in Schools” (2001) commissioned by AAUW Education Foundation, researched by Harris Interactive.
Sexual Harassment Frequency
- 81% of youth reported having experienced sexual harassment
- 35% of kids who were sexually harassed reported it was first experienced in elementary school
The numbers for bullying from a 1993 Hostile Hallways survey compared to this 2001 survey are almost the same in the area of sexual harassment.
For this study, a nationally representative sample of 2,064 public school students in 8th through 11th grades were interviewed (compared to 1,632 students interviewed in 1993).
Source: “Hostile Hallways: Bullying, Teasing and Sexual Harassment in Schools” (2001) commissioned by AAUW Education Foundation, researched by Harris Interactive.